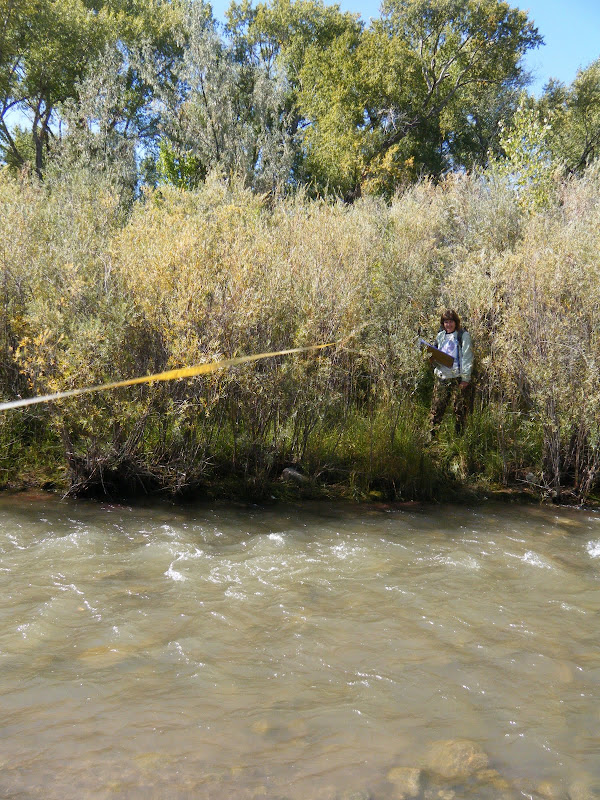
Most plants that cannot tolerate saturated soil conditions for days at a time, like Alders, will not grow below BF, while willows and cottonwood can. Also, the top of point or side bars can indicate the height of BF, but on the Rio Embudo, near Dixon NM, BF indicators were contradictory and hard to find. Is BF just a few centimeters above the base-flow water, or are all the willow below BF?
 |
| From Rio Embudo at Dixon, NM Hydrology Analysis |
 |
| From Rio Embudo at Dixon, NM Hydrology Analysis |
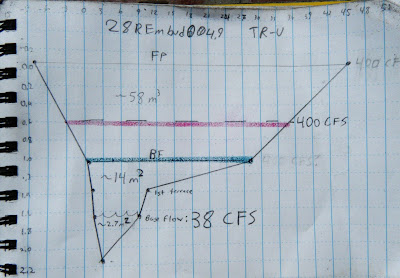
TR-Upper
 |
| From Rio Embudo at Dixon, NM Hydrology Analysis |
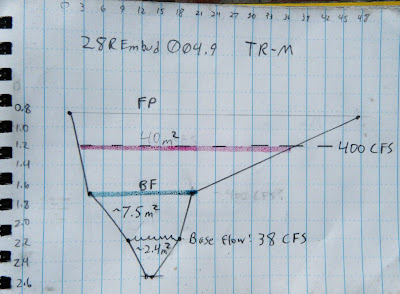
TR-Middle
 |
| From Rio Embudo at Dixon, NM Hydrology Analysis |
Tr-Lower
 |
| From Rio Embudo at Dixon, NM Hydrology Analysis |
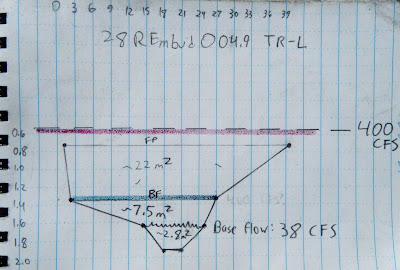
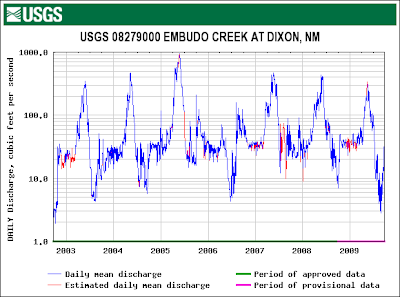
On each of these cross sections we marked where the current base flow water level is, where we think BF is, and where we think Flood Prone (FP) might be. To check these guesses, we correlated those heights with flow data from a USGS gauge just downstream:
 |
| From Rio Embudo at Dixon, NM Hydrology Analysis |
between the flow today and BF flow. To figure that out we might need to correct for any changes in the velocity (feet/second). Manning's Equation:
 shows that velocity V is proportional to a constant, u, inversely proportional to a coefficient of friction, n, varies to the 2/3 power of channel cross-sectional area, R, and to the 1/2 power of slope, S. Since neither slope nor the constant would change, we can discount them and focus on n and R; n will likely increase because the willows will act like a series of giant combs, increasing friction, and R will also obviously have to increase. For example, doubling the height of the water would multiply that term by 1.6. Unfortunately, coefficients of friction need to be experimentally determined, so we can only guess at n. To make things easier, I decided friction would also increase by a factor of 1.6, to exactly cancel out R. In other words, I don't think the velocity would change by much.
So it is a simple matter of geometry to calculate the cross-sectional area that would correspond to 400 CFS on our cross sections (red lines on the cross-sections, above). Without exception, this height is higher than our field-determined BF (green lines on the cross-sections, above) and, at least for TR-L, even higher than our FP height.
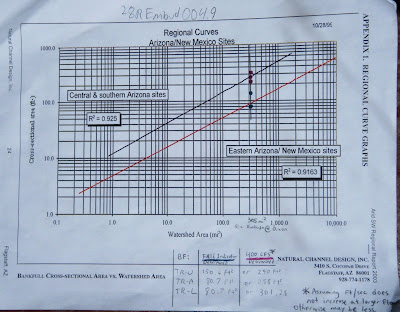
But is this right? Are we getting closer to the truth? To check, we can calibrate our answers for the Rio Embudo against data published by Natural Channel Design on a large number of other Southwestern rivers:
 |
| From Rio Embudo at Dixon, NM Hydrology Analysis |
This line is probably as close as any to Bankfull:
|
| From Rio Embudo at Dixon, NM Hydrology Analysis |
No comments:
Post a Comment